Data Analysis: Analysis of call center calls
👁 292
statistics
calculate
Questions #: 6
Time: 10 minutes
Pass Score: 80.0%
Many businesses operate call centers to serve customers who want to place an order or make an inquiry. Customers want their requests handled thoroughly. Businesses want to treat customers well, but they also want to avoid wasted time on the phone. They therefore monitor the length of calls and encourage their representatives to keep calls short. Here is an example of the difficulties this policy can cause.
We have data on the length of all 31,492 calls made to the customer service center of a small bank in a month. Table below displays the lengths of the first 80 calls.
| Service times (seconds) for calls to a customer service center | |||||||
| 77 | 289 | 128 | 59 | 19 | 148 | 157 | 203 |
| 126 | 118 | 104 | 141 | 290 | 48 | 3 | 2 |
| 372 | 140 | 438 | 56 | 44 | 274 | 479 | 211 |
| 179 | 1 | 68 | 386 | 2631 | 90 | 30 | 57 |
| 89 | 116 | 225 | 700 | 40 | 73 | 75 | 51 |
| 148 | 9 | 115 | 19 | 76 | 138 | 178 | 76 |
| 67 | 102 | 35 | 80 | 143 | 951 | 106 | 55 |
| 4 | 54 | 137 | 367 | 277 | 201 | 52 | 9 |
| 700 | 182 | 73 | 199 | 325 | 75 | 103 | 64 |
| 121 | 11 | 9 | 88 | 1148 | 2 | 465 | 25 |
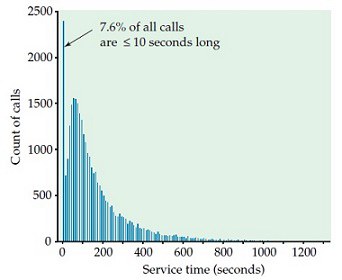
The below chart shows the distribution of call lengths for 31,492 calls to a bank’s customer service center, for this example.

Views:
Trials:
Avg score:
|
0
sin
cos
tan
sin-1
cos-1
tan-1
π
e
xy
x3
x2
ex
10x
y√x
3√x
√x
ln
log
(
)
1/x
%
n!
7
8
9
+
MS
4
5
6
–
M+
1
2
3
×
M-
0
.
EXP
÷
MR
±
RND
C
=
MC
|
Document Actions
