Television Viewing Habits
publish date: 2024/05/07 13:07:58.484236 UTC
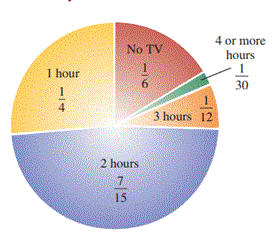
Students on a college campus were asked to estimate to the nearest hour how much television they watched each day. The results are given in the circle graph below (also called a pie chart). For example, the chart tells us that \(\frac14\) of those responding watched 1 hour per day. What fraction of the student body watches from 0 to 2 hours daily?

Correct Answer
Explanation
Analyze
- \(\frac16\) of the student body watches no TV daily (Given)
- \(\frac14\) of the student body watches 1 hour of TV daily. (Given)
- \(\frac{7}{15}\) of the student body watches 2 hours of TV daily. (Given)
- What fraction of the student body watches 0 to 2 hours of TV daily? (Find)
Form
We translate the words of the problem to numbers and symbols
[The fraction of the student body that watches from 0 to 2 hours of TV daily] is equal to [the fraction that watches no TV daily] plus [the fraction that watches 1 hour of TV daily] plus [the fraction that watches 1 hour of TV daily] plus [the fraction that watches 2 hours of TV daily]
The fraction of the student body that watches from 0 to 2 hours of TV daily = \(\frac16 + \frac14 + \frac{7}{15}\)
Solve
We must find the sum of three fractions with different denominators. To find the LCD, we prime factor the denominators and use each prime factor the greatest number of times it appears in any one factorization:
6 = 2 • 3
4 = 2 • 2
15 = 3 • 5
LCD = 2 • 2 • 3 • 5 = 60
Build each fraction so that its denominator is 60
$\frac16 + \frac14 + \frac{7}{15} = \frac16 \color{red}{\cdot \frac{10}{10}} + \frac14 \color{blue}{\cdot \frac{15}{15}} + \frac{7}{15} \color{green}{\cdot \frac44}$
Multiply the numerators and the denominators
$= \frac{10}{60} + \frac{15}{60} + \frac{28}{60}$
Add the numerators and write the sum over the common denominator 60
$= \frac{10 + 15 + 28}{60}$
The fraction is in simplest form
$= \frac{53}{60}$
State
The fraction of the student body that watches 0 to 2 hours of TV daily is \(\frac{53}{60}\)
Check
We can check by estimation. The result, \(\frac{53}{60}\), is approximately \(\frac{50}{60}\), which simplifies to \(\frac56\). The red, yellow, and blue shaded areas appear to shade about \(\frac56\) of the pie chart the result seems reasonable.
Reference
Mathematics for college students
