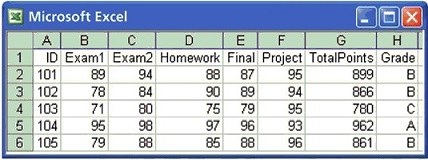
Data for students in a statistics class
publish date: 2022/06/30 22:20:00 GMT+10
The below figure shows part of a data set for students enrolled in an introductory statistics class. Each row gives the data on one student. The values for the different variables are in the columns. This data set has eight variables. ID is an identifier for each student. Exam1, Exam2, Homework, Final, and Project give the points earned, out of a total of 100 possible, for each of these course requirements. Final grades are based on a possible 200 points for each exam and the final, 300 points for
Homework, and 100 points for Project. Total Points is the variable that gives the composite score. It is computed by adding 2 times Exam1, Exam2, and Final, 3 times Homework plus 1 times Project. Grade is the grade earned in the course. This instructor used cut-offs of 900, 800, 700, etc. for the letter grades
- Give the values of the variables Exam1(1), Exam2(2), and Final(3) for the student with ID equal to 105
- A student whose data do not appear on the spreadsheet scored 88 on Exam1, 85 on Exam2, 77 for Homework, 90 on the Final, and 80 on the Project. Find Total Points(4) for this student and give the grade earned(5)

- (1)
- (2)
- (3)
- (4)
- (5)
Correct Answer
Explanation
- Exam 1 result = value of cell B6 = 79
- Exam 2 result = value of cell C6 = 88
- Final = value of cell E6 = 88
- Total points is calculated as
(Exam 1 result * 2 + Exam 2 result * 2 + Final result * 2 + Homework result * 3 + 1 * Project result) =
88 * 2 + 85 * 2 + 90 * 2 + 77 * 3 + 80 = 837
- Since Total points is between 800 and 900, then final grade is B
Reference
Introduction to the practice of statistics (6th edition),go-math-science.com
