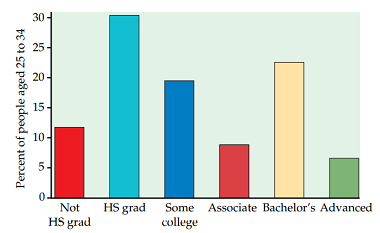
bar_graph.png
https://go-math-science.com/math/statistics/data-distributions/graphs-for-categorical-variables/pie-graph-vs-bar-graph/bar_graph.png/view
https://go-math-science.com/math/statistics/data-distributions/graphs-for-categorical-variables/pie-graph-vs-bar-graph/bar_graph.png/@@images/image-1200-df49776044654ab4307ce0fd27cb1bed.png
bar_graph.png

Dimension
380x233