Stemplots

👁 187
statistics
calculate
Questions #: 6
Time: 10 minutes
Pass Score: 80.0%
Style
Mode

Literacy of men and women

The Islamic world is attracting increased attention in Europe and North America. The table below shows the percentage of men and women at least 15 years old who were literate in 2002 in the major Islamic nations. We omitted countries with populations of less than 3 million. Data for a few nations, such as Afghanistan and Iraq, are not available.

To make a stemplot of the percentage of females who are literate, use the first digits as stems and the second digits as leaves. Algeria’s 60% literacy rate, for example, appears as the leaf 0 on the stem 6.  The figure below shows the steps in making the plot.

Country Female percent Male percent
Algeria 60 78
Bangladesh 31 50
Egypt 46 68
Iran 71 85
Jordan 86 96
Kazakhstan 99 100
Lebanon 82 95
Libya 71 92
Malaysia 85 92
Morocco 38 68
Saudi Arabia 70 84
Syria 63 89
Tajikistan 99 100
Tunisia 63 83
Turkey 78 94
Uzbekistan 99 100
Yemen 29 70


Making a stemplot of the data in the table.

  1. Write the stems.
  2. Go through the data and write each leaf on the proper stem. For example, the values on the 8 stem are 86, 82, and 85 in the order of the table.
  3. Arrange the leaves on each stem in order out from the stem. The 8 stem
    now has leaves 2 5 6.
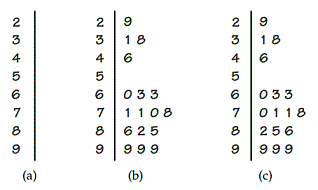
stemplot.gif

Acknowledged
POINTS (1)

Correct Answer

Explanation

A ___________ (also called a stem-and-leaf plot) gives a quick picture of the shape of a distribution while including the actual numerical values in the graph

Missing
POINTS (1)

Correct Answer

Explanation

Stemplots work best for a large number of observations that are all greater than 100

POINTS (1)

Correct Answer

Explanation

To make a stemplot

Order the following steps to make a stemplot

(1) transparent Write the stems in a vertical column with the smallest at the top and draw a vertical line at the right of this column.
(2) transparent Separate each observation into a stem consisting of all but the final (rightmost) digit and a leaf, the final digit.  Stems may have as many digits as needed, but each leaf contains only a single digit.
(3) transparent Write each leaf in the row to the right of its stem, in increasing order out from the stem.
drag and drop the selected option to the right place
Second
First
Third
POINTS (1)

Correct Answer

Explanation

We can compare two related distributions, as shown below, using a _________ stemplot

compare_stemplot.gif

POINTS (1)

Correct Answer

Explanation

In order to use stemplots with a moderate number of observations, you can double the number of stems in a plot by splitting each stem into two

POINTS (1)

Correct Answer

Explanation

Views:
Trials:
Avg score:
0
sin cos tan
sin-1 cos-1 tan-1 π e
xy x3 x2 ex 10x
y√x 3√x √x ln log
( ) 1/x % n!
7 8 9 + MS
4 5 6 M+
1 2 3 × M-
0 . EXP ÷ MR
± RND C = MC

Document Actions